An Emerging Model
Thomas M. Zachariah, Department of Mathematics, Suzanne Larson, Department of Mathematics, Jacqueline M. Dewar, Professor of Mathematics, Loyola Marymount University, Los Angeles, California
A 2006 SENCER Model
Abstract
This “emerging” model consists of the incorporation of SENCER strategies into an existing general education course (Math 102-Quantitative Skills for the Modern World) that is required for all students at Loyola Marymount University except those majoring in STEM disciplines, or other fields requiring further study in math and statistics (such as education, psychology, or business).
The new element in the course was the incorporation of a semester-long group project that explores the power of mathematics to address a specific problem or question that directly impacted members of the campus or local community. The ten topics developed in the 2005-6 academic year ranged widely, from an analysis of Social Security receipts and payments under the current system and under President Bush’s proposed system, to a comparison of on-campus and off-campus living expenses. Three of the projects were student designed, including an analyses of the sufficiency and safety of campus parking, an investigation of college students work hours and their effect on academic work, and calculations of student loan debt and its effect on the financial future of graduates.
The specific mathematical operations used in the course vary depending on the nature of the project, but a checklist of mathematical content areas has been developed to guide the project design process and to help students track what mathematical knowledge will be needed to complete their investigation. Unit conversions, the use and abuse of percentages, absolute and relative error, statistical inference, margin of error, and the creation of computerized spreadsheets and graphs are some of the mathematical concepts presented in the course that were used by students in their independent projects.
Learning Goals
What mathematics is covered and how is it linked to the civic content?
The following list, entitled “What Mathematics Should We Do For Our Project?” includes all the mathematical topics discussed in the course and describes the various ways in which these topics might be used in a typical investigation of a local civic issue. Of course, the exact topics any particular group uses will vary depending on the nature of their project. Students can use the list to track their progress through the course, and it should be especially useful to students who are designing their own project. When instructors introduce each stage of the model project in class, they can refer to the list to indicate which of the topics might be especially pertinent for that stage of any of the student projects. It could be turned into a checklist or form the basis for a final reflection by the students on what mathematical topics have underpinned their investigations.
What mathematics should we do for our project?
- Working with Units and Converting Units: Would the results found in sources or calculated by your group be put in better perspective in different units? If so, identify more appropriate units, and calculate the unit conversions. (For example, it would be better to report the average speed of a Greenland’s Jakobshavn Isbrae glacier in miles per year than in miles per hour.)
- Uses and Abuses of Percentages
- Counts vs. percentages: Will reporting percents, rather than just a count (number of things) be more enlightening? (For example, when comparing auto thefts that occurred on various sized college campuses, it would be more informative to report percentages of cars that were stolen from each of the campuses in a certain year than just the number of car thefts that occurred on each campus.)
- Percentages to describe change: Is there a quantity that has changed over time? Calculate the percent change of this quantity.
- Percentages for comparisons: Are there two quantities that you would like to compare? Calculate the percent that one quantity is more than the other quantity, or calculate the percent that one quantity is of the other.
- Misuses of percentages: Have you found any misuses of percentages in any of your sources? If so, show where/how the misuse occurs. Calculate the correct percentage.
- Putting Numbers in Perspective, Significant Digits
- Perspective through comparisons: Are there any very large or very small numbers involved that could be better “made sense of” through comparisons? If so, calculate at least one meaningful comparison. (For example, if LMU’s bookstore found next fall, there would be a $125,000 increase in the cost of ordering textbooks, it would help us to understand the impact of this increase by calculating that this represents an average increase of $235,000/8300 = about 28 dollars per LMU student.)
- Absolute, relative error: Can you calculate the absolute or relative error to any measured quantities involved?
- Combining and reporting measured numbers: Are you reporting results of measurements with an appropriate (and not misleading) number of significant digits? When adding, subtracting, multiplying or dividing measured numbers have you reported the results with the appropriate number of significant digits?
- Power of Compounding
- Simple interest: Are there financial accounts involved that earn simple interest? Are there quantities (of any kind) involved that will grow over time at a rate proportional to the original quantity? If so, use the simple interest formula to predict account balances or quantities at various (later) times.
- Compound growth: Are there financial accounts involved that earn compound interest? Are there quantities (of any kind) involved that will grow over time at a rate proportional to the quantity in the previous time period? If so, use the compound interest formula to predict account balances or quantities at various (later) times.
- Annual percentage yield: Can you calculate the actual percentage by which a balance (quantity) will increase in one year?
- Savings Plans and Investments
- Savings Plan Formula: Are there any savings plans (annuities, retirement savings plans) involved for which it would be helpful to predict account balances at (various) future times? Or do you want to know what regular savings will yield a desired amount at a future date? If so, use the savings plan formula. You may want to use the formula to predict account balances under various assumptions about interest rates, quantities deposited etc.
- Total and Annual Return: Is there an investment or quantity that has grown from some original quantity to a later quantity? It may be of interest to calculate the relative change in the investment and the annual percentage yield that would give the same overall change in the investment (quantity). That is, calculate the total return and annual return for the investment.
- Liquidity, Risk, and Return: Are there investments involved? If so, evaluate the investments for their liquidity, risk, and return.
- Loans and Credit Cards
- Loan Payment Formula: Are there (installment) loans involved? If so, find the required monthly payment using the terms of the loan. Could the terms of the loan vary – such as the interest rate or the life (length) of the loan? If so, recalculate the required monthly payment using the various terms.
- Amortization Tables: Would it be helpful to be able to track the loan balance and interest paid over the life of a loan? If so, create an amortization table showing the payment date, payment amount, payment amount of interest, payment amount of principal, and account balance for each month of the loan.
- Predicting Credit Card Bills: Do credit cards play a role in your project? Can you calculate the amount due at various times for a certain credit card (assuming a certain previous balance, interest rate, and method of charging interest)? Given a certain credit card balance and desired timeframe to pay off the entire balance, use the loan payment formula to calculate the amount that must be paid each month in order to pay-off the credit card balance.
- Loan Payment, Prepayment Strategies: If there are (installment) loans involved, calculate the effect on the loan payment, total interest paid over the life of the loan and the length of the loan by (voluntarily) paying an extra amount each month.
- Fundamentals of Statistical Studies: Will you be carrying out a statistical study? If so, develop the basic steps for your statistical study: (i) develop the precise goal and population for your study; (ii) determine how you will choose a representative sample for your study; (iii) determine what raw data will you collect and what sample statistics you will calculate; (iv) determine what inferences you can make about the population parameters from the sample statistics; and (v) look back and evaluate your study and its results.
- Sampling Methods: Will you be choosing a sample as part of your statistical study? If so, carefully consider possible methods of choosing a (representative) sample and the feasibility of each method. Will you use simple random sampling, systematic sampling, convenience sampling, quota sampling, stratified random sampling etc?
- Should You Believe a Statistical Study? Have you evaluated the results of statistical studies you reference by considering the eight guidelines in our text for evaluating a statistical study? Have you evaluated the methods you use in your own survey project against the eight guidelines in our text for evaluating a statistical study?
- Statistical Tables and Graphs: Which of the following types of statistical tables and graphs will best
summarize the data you have collected – frequency tables, bar graphs, pie charts, histograms, line charts? After deciding on appropriate data categories (or bins), use a spreadsheet program to construct statistical tables and graphs from your results. - Characterizing a Data Distribution
- Measures of center: Can you summarize your data by calculating a mean, median, and/or mode value? Are there outliers in your data? If so, what effect do the outliers have on the mean, median, mode values?
- Shapes of distributions: What features does the distribution of your data have? Is there more than 1 peak to the data distribution? Is the distribution symmetric or skewed? Does it show large or small variation?
- Measures of Variation: Did you use a median value to describe the center of your data? If so, compute the quartiles and the five number summary as a measure of the variation in your data. Did you use a mean value to describe the center of your data? If so, compute the standard deviation as a measure of the variation in your data. Give interpretations of what your measures of variation tell about the data.
- Normal Distribution: Are there any normal distributions of data involved? If so, is it appropriate to
calculate standard scores and percentiles corresponding to certain data values? - Central Limit Theorem: What does the Central Limit Theorem say about the distribution of sample
proportions or sample means taken from many different samples? What does this say about sample proportions or sample means you have calculated? - Statistical Inference
- Statistical significance: Does any of your background research indicate that certain measurements are “statistically significant?” If so, give some interpretation of what it means to say they are statistically significant.
- Margin of error, confidence intervals: Have you calculated a mean or percentage (proportion) using data values of a sample collected from a large population? If so, determine the appropriate confidence level(s), then calculate the associated margin of error and confidence interval, and finally give an interpretation of the meaning of each confidence interval.
- Income Taxes: Are there tax implications involved with the financial aspects of your project? If so, calculate the taxes an individual owes under the (various) financial actions projected.
- Computer Spreadsheets: Are there forms, charts, graphs or financial calculations you can create or
perform using a spreadsheet?
Linking Mathematics and Social Issues
How Quantitative Literacy Links Mathematics and Civic Issues
Why is this course an emerging SENCER model?
In keeping with SENCER’s vision of teaching
“To” basic science and mathematics
“through” complex, capacious, and unsolved public issues,
our approach incorporates semester-long collaborative group projects involving local community issues that students can investigate by using the mathematics of MATH 102 (number sense, elementary statistics, mathematics of finance, computer spreadsheets) as tools.
What are the Civic Questions Addressed?
In our course, “civic” takes on a very local interpretation. The civic questions students investigate are primarily drawn from local campus or immediate community issues. Many topics, such as the cost of college textbooks, use of the student health center, campus parking availability and safety, have a very clear and direct impact on students’ lives. The decision to emphasize local issues was influenced by a Fall 2004 survey of students on our campus, which indicated students were most interested in financial issues that directly affected them. We present below a list of the ten project topics developed during 2005-6, and we identify the three that were student generated and the one that was presented as a model. We did allow more than one group within a single section of the course to select the same topic.
The Course
Course Syllabus
Course Design
Course Management and Strategies
For our SENCER course we modified a fairly traditional quantitative literacy course by incorporating collaborative group projects that addressed campus or local community issues. Therefore, in this section we will focus on the general structure and assessment of the group projects. Pedagogical issues are discussed in detail in our course manual (see http://myweb.lmu.edu/tzachari/sencer.html). We present here the generic project framework (which includes a statement of purpose, introductory reading, four project stages, and a timeline), a detailed description of what is due at each stage, and the overall project evaluation rubric. Our course manual contains the complete project frameworks for all projects developed during 2005-6, additional assessment tools, other materials that we developed and everything needed to present a model project on student loan debt.
Projects
Generic (or Design Your Own) Project Framework
Purpose: What is the purpose/focus of the project? How does the project connect to your own community (on/off campus)? Be sure to consider what sort of mathematical skills it is likely to require.
Introductory Reading: List some appropriate background reading
Project Stages
Stage 1. Background Investigation: In addition to background reading what other information should be gathered?
Stage 2. Planning and Preparation: Plan and prepare to gather data, information, or evidence appropriate to answering your question by applying knowledge gained from this course. This might involve a survey, focus groups, interviews or developing a case study.
Stage 3. Action, Analysis, Conclusion: Collect and analyze information and evidence by applying knowledge gained from this course. This might involve the following: tabulate the data, represent it using graphs, compute numerical summaries, find confidence intervals. For case studies, include calculations and any underlying assumptions. Draw conclusions.
Stage 4. Response/Dissemination: Write a report, prepare an oral report and a PowerPoint presentation, and undertake an active response to your findings. This might include recommendations to the class, a letter to the campus newspaper, or a presentation at an undergraduate research conference.
Timeline:
Please discuss your project idea with your instructor.
Week 3 – Submit a one-page (maximum) written proposal for your project idea stating:
- What is the purpose/focus of the project?
- How does the project connect to your own community (on/off campus?)
- What sort of mathematical skills is it likely to require?
- Suggested background reading
Week 4 – Student groups and project topics are finalized
Week 7 – Stage 1 deadline for completion
Week 10 – Stage 2 deadline for completion
Week 12 – Stage 3 deadline for completion
Week 15- Stage 4 deadline for completion
Projects: What is Due at the End of Each Stage?
Stage 1: Due in Week 7 of the Semester
What is Due at the End of Stage 1?
- Cover sheet with project title, members’ names, date, stage number.
- An annotated bibliography of each of the resources.
- A paragraph summary of what your group learned from the background investigation.
- A glossary of terms pertinent to your project.
- A photocopy of the notes you have taken during this stage.
Stage 2: Due in Week 10 of the Semester
What is Due at the End of Stage 2?
- An outline of your plan of action for the investigation.
- Depending on your project:
- For projects with surveys: a copy of the survey instrument together with a description of your proposed sampling method.
- For case studies: a copy of your case study referenced with footnotes, other supporting documents, and data collection forms.
- A copy of any (new) notes or calculations.
Stage 3: Due in Week 12 of the Semester
What is Due at the End of Stage 3?
- A copy of all of the data collected, calculations performed, and resulting graphics. If a survey was involved these would typically include mean, median, mode, standard deviation, confidence interval for the mean, and a box-plot. If a case study was involved, then give sources for the data and clearly state any assumptions made for the calculations.
- A paragraph summarizing what your group learned from the action, analysis and conclusion stage.
- A brief statement of your conclusion.
- If this was a Design Your Own Project, also submit a formal project framework including the purpose, suggested background reading, and a description of each of the 4 stages. Use the project frameworks given out at the beginning of the semester as a guide for this.
Stage 4: Due in Week 14 of the Semester
What is Due at the End of Stage 4?
- The Written Report for Your Project
The following lists essential components of and provides a uniform structure for your written report.
Title: The title must capture the central theme of the paper. It should be short. Usually it is centered, bold, and is in a larger font that the rest of the paper.Names: List the names of your group members below the title.Table of Contents: Help the reader easily navigate through your report with a table of contents/tabs/page numbers. NOTE: If this was a Design Your Own Project, include a final version of the Project Framework (purpose, background reading, and description of the 4 stages) immediately after the Table of Contents.Introduction: Catch the reader’s attention and then clearly state the topic or problem and explain your goals.
Main Body: Organize the main body logically so that it is easy to follow. Divide it into several sections using section headings as needed. Be sure that your data is presented and summarized in appropriate ways. Include summary statistics such as mean, median, standard deviation, and 5-number summaries, as appropriate. Also, include histograms, bar charts, pie charts etc. as appropriate. Address the question of validity of your sample or rationale for your case study approach. Do not include large amounts of raw data in this section; put these in an Appendix. Do show the details of important calculations, but put these in an Appendix. Remember, your paper will be evaluated (in part) on having adequate and correct mathematical content.
Conclusion: Summarize the conclusions of the project. Include any limitations of your work and suggestions of related topics for future work that could extend this project.
Bibliography: Provide documentation of all sources including full documentation on web sources (not just a URL).
Data and Calculations Appendices: Place all raw data and calculations in
separate appendices.Action Response Appendix: Include in a separate appendix the response action (letter, article, memo and summary report, etc.) you have taken as a result of your project (see item #3 below).
Proof read, proof read, proof read!!
2. The Oral Report
Aside from the bibliography and appendices, your oral presentation should have the same features as your written report. However, your oral report is to be just 20 minutes long (15 minutes for the actual presentation and 5 minutes for question and answers and transition), and so you will not be able to cover all of the material in your written report. All team members need to be a part of the presentation. The following lists a few tips for giving a mathematical talk.
Organize and prepare your talk ahead of time. Experienced speakers know that a lot of preparation is required to give a concise and interesting talk. There is a wonderful quote, attributed to Abraham Lincoln: “If you want me to give a ten minute speech, give me two weeks
Evaluating Learning
Evaluation and Assessment
We have undertaken various evaluations to measure the success of the SENCER QL course (1) against our original course goals, and (2) in comparison to the standard QL course on our campus. These include the SALG, Focus Groups, Survey Comparisons, Pre/Post tests results, and Pre/Post knowledge survey results. A summary of the results of each follows.
SALG
As a means of obtaining student evaluation on various aspects of the course in general, we made use of the on-line Student Assessment of Learning Gains (SALG) tool (http://www.wcer.wisc.edu/salgains/instructor/) that was developed by the SENCER project grant (http://www.sencer.net/). This free site is offered as a service to the college-level teaching community. This instrument is a powerful tool, can be easily individualized, provides instant statistical analysis of the results, and facilitates formative evaluation. At the site, any instructor in any discipline who would like feedback from their students about how various course elements are helping their students to learn can begin with a general template survey form and modify it to meet their own needs. However, all projects supported by SENCER were directed to use a special SENCER SALG survey template. At the time we began work on our project, there was a single version of the SENCER SALG template. We found a number of the questions to be too oriented toward science courses to be useful with a math class. We created more math-oriented versions of these questions and have used the math-oriented version of the SENCER SALG.
Students were given, at the beginning of the semester, an assignment to complete the pre-course SENCER MATH SALG survey and, at the end of the semester, an assignment to complete the post-course survey. While the SALG was easy to administer, and most students completed the assignments, we encountered some problems with the instrument. When students log on to complete the survey, the default setting in the system is the “pre-test.” We discovered that a number of students accidentally completed the pre-course survey when they should have been completing the post-course survey. This resulted in the pre-course survey results being somewhat biased and the post-course survey results being incomplete.
Both students in the standard and the SENCER QL course completed the MATH SALG survey. In comparing results between the two groups of students, we see only small differences. Perhaps this is largely due to the similarity in course content and the fact that the standard course was already fairly successful in meeting its basic goal of developing quantitative literacy. In addition, it was not possible to include a specific question about how “the projects” influenced student learning as the same MATH SALG instrument was used with students in the standard course where projects were not assigned. Therefore we used other forms of assessment in addition to the MATH SALG, and we describe below where the other assessment tools did show greater differences between the two groups of students.
Three Focus Groups
Prior to developing the SENCER QL course we held a small focus group in Fall 2004 with students in the standard QL course to find out what they thought of the concept. From this we learned that they were most concerned about collaboration issues (would they end up doing all the work?) and the additional time and workload demands of adding a project to the existing coursework.
In Fall 2005 we conducted a focus group with 19 volunteers (out of a total enrollment of 99) from the 4 sections of the SENCER QL literacy course. The students generally agreed that mathematics was NOT a favorite subject. They observed that the projects approach afforded them an opportunity to demonstrate their skills and abilities beyond what “cramming for a final exam would.” This group of students replied quite positively when asked if the projects approach should be retained (15 yes, 3 no, 1 not sure).
In Spring 2006 we conducted a focus group during class-time that was attended by 10 (out of an total enrollment of 11) students. This group of students enlightened us about their discomfort with the open-ended nature of the projects and the lack of direction about exactly which mathematical methods to apply at each stage.
Course Survey Comparisons
During 2005-6 we surveyed 62 students in several sections of the standard QL course and 29 of the students in the SENCER QL course. They gave strikingly similar responses about the usefulness of mathematics, which demonstrates that the standard version of course was already doing a good job of reaching one of its goals. However, students in the SENCER QL course had much greater awareness of community issues after the course as shown in the following chart.

For students in the SENCER QL class we also asked some questions that related directly to the projects. We found that 79% agreed that their projects enabled them to connect their classroom learning (elementary statistics, mathematics of finance, computer spreadsheets) to campus or community issues and 79% also said it helped them practice and learn mathematical or analytical skills. In addition, 59% reported that the project experience taught them non-mathematical skills (e.g., working with people, time management, writing/distributing a survey).
Pre and Post Test Results
All students in the SENCER QL course took a 9 problem multiple-choice pre and post-test. The problem topics were: percentages, putting numbers in perspective, savings plans, credit cards, loans, statistical studies, the normal distribution, margin of error, and spreadsheets. The pre and post-test did not have identical problems, but problem types were matched, so that pre and post-test comparisons could be made for each problem type. A sample pre-test can be found in Appendix A. The following bar chart summarizes the results by question type.
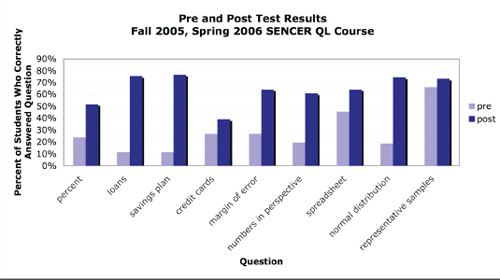
Every question type shows a gain in the percentage of students who were able to answer correctly, although the areas of credit cards, spreadsheets, and representative samples did not show as large a gain as in the other types of questions. Note, however, for the questions on spreadsheets and representative samples, students did fairly well on the pre-test and so we would not expect to see a very large gain. The disappointing post-test performance on the credit card question may be due to the fact that the topic is covered by a handout that supplements the text and therefore the students may not consider it important.
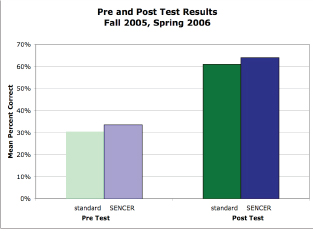
Students in the standard course also took pre and post-tests. For these students, the pre and post-test was a 12 problem multiple-choice test. Nine of the twelve problem types correspond to problem types that appeared on the SENCER QL preand post-test. (In fact, the problems came from the same problem bank.) The mean percent correct on both the pre and post-test are very similar for the standard vs. SENCER QL courses, as the chart below indicates.
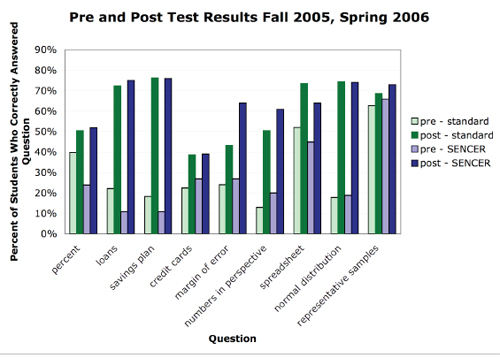
The following chart compares the standard and the SENCER QL courses in these nine problem areas. The greatest difference between the post-test results is that the percentage of students from the SENCER QL course who were able to answer correctly a question relating to interpreting the margin of error exceeded the percentage of students from the standard course by approximately 20 percentage points. We speculate that the survey-based projects encouraged students to think more carefully about interpreting a margin of error.
Pre and Post Knowledge Survey Results
A knowledge survey contains content questions that test mastery of particular course learning objectives. The questions are presented in the same order as the material is presented during the semester. Students take knowledge surveys at the beginning and the end of the semester. They respond to the questions, not by providing answers, but by indicating on a three-point scale how confident they are that they could correctly answer the question. Knowledge surveys can address both basic skills and complex open-ended questions. Time limitations would prevent students from directly answering all the questions on a thorough knowledge survey, but they can rate their confidence to provide answers in a fairly short time period. Tests can only address a limited portion of a course, while knowledge surveys can cover one in depth. Class averages on knowledge surveys have been shown to be good representations of the class’s knowledge and abilities. The knowledge survey we constructed for our SENCER QL course in Spring 2006 can be found in Appendix B. The bar chart below summarizes the results.
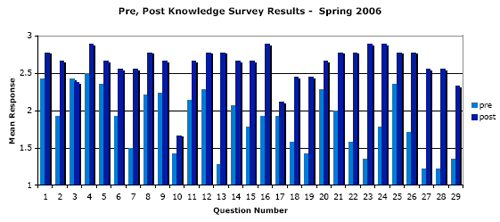
Questions 1-9 on the knowledge survey are questions relating to number sense (percents, significant digits, putting numbers in perspective), and many of these topics are topics students have seen in the past, so it is not surprising that the preknowledge survey ratings are fairly high. Question 10 related to Simpson’s paradox, a topic that was not actually covered in the course, so we should not expect the post-knowledge survey to show improvement on that item. Questions 12-18 relate to financial matters (savings plans, loans, taxes, investments) and the results show good improvement in the students’ confidence in their ability to solve these problems. Questions 19-26 relate to statistics, and again show good improvement in the students’ confidence in their ability to solve these problems.
Conclusions About Student Learning
The Pre- and Post-tests and knowledge surveys give evidence of students’ improved quantitative skills. On the course surveys nearly 80% of students in the SENCER QL sections agree that the projects approach helped them to connect their classroom learning to the real world and gave them an opportunity to practice and learn mathematical or analytical skills. But the “best college teachers” hold, and we agree, that meaningful learning involves not only content mastery but also changes in attitude and beliefs. 5 A typical student taking the quantitative literacy course to meet her general education requirement in mathematics often does not like mathematics very much. This underlying dislike of mathematics can still come through at the end of the course; for example, a student agreed with the statement The project helped me connect my classroom learning to the real world and then went on to write: More so than any other boring math class. However, the course surveys also indicate that after the course students are more aware of the usefulness of mathematics and of local community issues. What may be the most significant impact is the hardest to assess – namely, the potential benefits gained from the project experience of tackling an open-ended question as a member of a team. We do know that nearly 60% of those surveyed reported that the project experience taught them non-mathematical skills.
Conclusions and Reflections
In this section we first address the question of whether we met our project goals, and then we reflect back on the value of incorporating group projects into the course.
Did we meet our project goals?
The specific goals stated in our original SENCER proposal were to:
- develop an alternate version of our current math core class (MATH 102 Quantitative Skills for the Modern World) that would be accessible to students with only a high school math background and in which students learn and apply mathematics to address problems in the greater Los Angeles area (and hence became ‘civically engaged’);
- have each of the three mathematics faculty on the team teach at least one section of the course during academic year 2005-6;
- recruit other faculty to teach this SENCERIZED version of the course.
Goal (1) has been met subject to the very local campus and community nature of our projects rather than drawing on the greater Los Angeles area for all of the project topics. We exceeded Goal (2) because the three mathematics faculty on the team taught a total of 5 sections of the revised course during 2005-6. Our success at Goal (3) remains to be seen. It is the case that 15 faculty attended the mathematics department seminar talk we gave on April 10, 2006 and that 9 faculty (6 full-time tenure track, 2 part-time and 1 full-time non-tenure track) attended the two-hour dissemination workshop we presented on May 10, 2006. The latter was intended to familiarize potential instructors of the course with the projects-based approach and materials we have developed. Of the 9 faculty present, 100% “Agreed” or “Strongly Agreed” with all three of the following statements:
As a result of attending this workshop I have a better idea about:
The rationale for teaching MATH 102 with projects
The materials that are available to teach MATH 102 with projects
How to teach MATH 102 with projects.
When asked if they would willingly volunteer to teach the SENCER version of the quantitative literacy course 56% said “yes” and 44% said they were “not sure.” Every person who responded “not sure” went on to comment that it was the extra time commitment that made him or her hesitate. Those who responded positively commented; “It would be fun.” “It sounds cool.” “Great way to engage students with material – gives student valuable experience.” “Seems rewarding, but wouldn’t do it with other new preparations.”
One of the original developers will be teaching the SENCER QL course in Fall 2006. The final version of the materials we have developed will go to faculty teaching this course along with an invitation to adopt the SENCER projects approach.
Reflection: Making a case for group projects
To make a case for group projects we turn to a well-known and provocative article Seven principles for good practice in undergraduate education written by Chickering and Gamson for the entire spectrum of higher education – faculty members, campus administrators, state agencies and government policy makers, and later amplified into a book6. After reflecting back on our year’s experience using group projects in a quantitative literacy course, we find that this approach measures up rather well to the seven principles. We give the details in Appendix C.
Appendix A: Sample Pre/Post Test
Appendix B: Knowledge Survey
Background and Context
Contacts
Thomas M. Zachariah
Department of Mathematics
Loyola Marymount University
(310) 338-5109
tzachari@lmu.edu
Curriculum vitae
Suzanne Larson
Department of Mathematics
Loyola Marymount University
Curriculum vitae
Jacqueline M. Dewar, Ph.D.
Professor of Mathematics
Loyola Marymount University
Curriculum vitae
Related Resources
Backgrounders:
Mathematical and Statistical Reasoning
Reinventing Myself as a Professor
E-Newsletters:
April 2006
“Whittier College” p. 3
May 2006
“Science, Math Ed. Display …” p. 4
June 2006
“SSI Participants” p. 3
“Challenging Work” p. 4
November 2006
“Computation Science” p. 6
January 2007
“Capitol Hill Symposium” pp. 7-10
March 2007
“NCSCE Capitol Hill Symposium and SENCER Poster Session Participants Showcase Innovative Projects” pp. 3-6
References:
Bain, K. (2004). What the best college teachers do. Cambridge, MA: Harvard University Press.
Chickering, A. W., & Gamson, Z. F. (1991). Applying the seven principles for good practice in undergraduate education. New Directions for Teaching and Learning, 47.Hathaway, D. (2005, April). Graphic violence. Math Horizons, 14-16.
Knufer, E., & Knipp, D. (2003). The knowledge survey: A tool for all reasons. To Improve The Academy, 21, 59-78.
Bennet, J. O. & Briggs, W. L. (2007). Using and Understanding Mathematics: A Quantitative Reasoning Approach (4th Ed.). Upper Saddle River, NJ: Addison Wesley/Pearson.